Data Analyst
Step-by-Step Career Roadmap Guide to Get Job-Ready
Every industry is sitting on more data than it knows what to do with. Organizations are hiring data analysts to make sense of it. That is what makes data analytics one of the most durable career bets right now.
Every industry is sitting on more data than it knows what to do with. Organizations are hiring data analysts to make sen...
224,000+
$93,113

Top Industries
Hiring Data Analysts
92%
Job Satisfaction
What Does a Data Analyst Do and Why Businesses Need Them?
A data analyst turns messy data into clear insights, helping businesses make smarter, faster decisions across finance, healthcare, e-commerce, and tech, where the right numbers can change everything.
A data analyst turns messy data into clear insights, helping businesses make smarter, faster decisions across finance, healthcare, e-commerce, and tech, where the right numbers can change everything.
Analyzing KPIs
Tracking business metrics and performance indicators
Exploratory Analysis
Conducting ad-hoc and exploratory data analysis
Dashboard Building
Building dashboards and reports for stakeholders
Cross-Team
Collaboration Working with product, ops, finance, and marketing teams
Who Is This Career For?
You do not need a tech degree to become a data analyst.
Data and Spreadsheet
Proficient Strong with spreadsheets and numbers across finance, operations, marketing, or sales
Analytical and Curious
Naturally inquisitive with a drive to explore insights and solve problems by letting evidence lead the way
Clear Data Communicator
Able to translate data findings into understandable and actionable language

Recommended Courses


.jpg)


Data Analyst Salary Snapshot
Compensation* grows meaningfully as you move from foundational analysis into strategic and leadership-level roles.
$50,000 - $80,000
+10% Annually
Entry Level Data Analyst
$85,000 - $110,000
+12% Annually
Mid-Level Data Analyst
$105,797 - $164,380
+18% Annually
Senior Data Analyst
Entry Level Data Analyst
$50,000 - $80,000
Mid-Level Data Analyst
$85,000 - $110,000
Senior Data Analyst
$105,797 - $164,380
*All salary figures referenced are based on data reported by employees on Glassdoor.
Step-by-Step Data Analyst Career Roadmap
Who This Is For
Fresh graduates entering data or analytics roles
Professionals switching from adjacent fields
Those building skills in Excel, SQL, and visualization
Fresh graduates entering data or analytics roles
Professionals switching from adjacent fields
Those building skills in Excel, SQL, and visualization
Role Outcomes
Build foundational data manipulation skills
Learn to visualize and communicate findings
Develop proficiency with core analytics tools
Understand business metrics and KPI frameworks
Tool Stack
Technical Skills
SQL Fundamentals
Excel Fluency
KPI Literacy
Data Cleaning Basics
Chart and Dashboard Basics
SQL Fundamentals
Excel Fluency
KPI Literacy
Data Cleaning Basics
Chart and Dashboard Basics
+ 4 more skills
Soft Skills
Structured Thinking
Written Communication
Attention to Detail
Problem Framing
Stakeholder Follow-Up
Structured Thinking
Written Communication
Attention to Detail
Problem Framing
Stakeholder Follow-Up
Example Deliverables
Spreadsheet Dashboard
Build a live dashboard that tracks and visualizes key metrics for a business
KPI Explainer
Define and explain the metrics that matter most and why they move the needle
SQL Churn
Write and run a SQL query to surface patterns and summarize findings in plain language
KPIs
Report Turnaround Time
Dashboard Completeness
KPI Definition Accuracy
Onboarding Task Completion
Query Output Quality
Interview Checkpoint
Walk me through how you would clean and prepare a messy dataset.
How would you build a dashboard to help a sales team track weekly performance?
How would you explain a drop in conversion rate to a non-technical stakeholder?
Fresh graduates entering data or analytics roles
Professionals switching from adjacent fields
Those building skills in Excel, SQL, and visualization
Fresh graduates entering data or analytics roles
Professionals switching from adjacent fields
Those building skills in Excel, SQL, and visualization
Build foundational data manipulation skills
Learn to visualize and communicate findings
Develop proficiency with core analytics tools
Understand business metrics and KPI frameworks
SQL Fundamentals
Excel Fluency
KPI Literacy
Data Cleaning Basics
Chart and Dashboard Basics
SQL Fundamentals
Excel Fluency
KPI Literacy
Data Cleaning Basics
Chart and Dashboard Basics
+ 4 more skills
Structured Thinking
Written Communication
Attention to Detail
Problem Framing
Stakeholder Follow-Up
Structured Thinking
Written Communication
Attention to Detail
Problem Framing
Stakeholder Follow-Up
Spreadsheet Dashboard
Build a live dashboard that tracks and visualizes key metrics for a business
KPI Explainer
Define and explain the metrics that matter most and why they move the needle
SQL Churn
Write and run a SQL query to surface patterns and summarize findings in plain language
Report Turnaround Time
Dashboard Completeness
KPI Definition Accuracy
Onboarding Task Completion
Query Output Quality
Walk me through how you would clean and prepare a messy dataset.
How would you build a dashboard to help a sales team track weekly performance?
How would you explain a drop in conversion rate to a non-technical stakeholder?
Key Things to Know
Your first role focuses on supporting data requests, building dashboards, writing SQL queries, and developing the habit of translating numbers into plain business language.
You learn how to clean and validate data, navigate analytics tools, define KPIs, and present findings in a way that non-technical teammates can act on.
The shift begins by moving from answering "what happened" to answering "why it happened" and "what to do about it." This change in framing is what truly distinguishes a mid-level analyst from an entry-level one.
Effectiveness comes down to the ability to scope a business question, pull reliable data, interpret it clearly, and communicate findings to people who did not run the query.
The focus shifts from completing analyses to setting the measurement agenda. This means deciding what gets tracked, ensuring data reliability, and helping leadership understand what the numbers actually mean for the business.
Success is tied to the quality and reliability of the analytics infrastructure you help build, the business outcomes that follow from data-informed decisions, and the clarity you bring when presenting insights to executive audiences.
How to Get Started
Your learning roadmap from beginner to job-ready analyst
1. Entry-Level Foundations
Learn
What data analysts do, and how the role differs from data science or engineering
KPI literacy: CAC, LTV, revenue per user, conversion rate
Excel fluency: formulas, pivot tables, and charts
SQL basics: SELECT, WHERE, GROUP BY
Practice & Deliver
1 spreadsheet dashboard for a fictional business
1 KPI explainer for a business scenario
1 SQL query solving a basic business question
Pick A Learning Path
Track A
- Business Analytics with Excel
- SQL Certification Course
- Python Refresher with AI
Track B
- Excel in Business Analytics
- SQL Fundamentals Module
- KPI Mini-Workshop
Track C
- Program Orientation
- Intro to Analytics
- Excel and SQL Foundation
2. Core Data Skills
Learn
SQL: Joins, aggregates, CTEs
Excel: Advanced lookups (INDEX-MATCH, XLOOKUP), dynamic dashboards
Stats: Mean, median, standard deviation, correlation
Python: EDA with pandas and matplotlib (basics)
Practice & Deliver
1 Excel sales or operations dashboard
1 SQL churn analysis with commentary
1 BI dashboard answering 3 stakeholder questions
Pick A Learning Path
Track A
- Data Analytics with R
- Tableau Desktop Specialist Training
- Introduction to MS Azure Data Analytics
Track B
- Python EDA I: Cleaning and Profiling
- Data Analytics with Python
- BI 101
Track C
- Term-wise Modules: SQL, Excel, BI
- Guided Labs throughout the program
- Statistical Data Analysis
3. Programming and BI Tools
Learn
Python EDA: pandas and matplotlib
BI: calculated fields, parameters, and slicers
Data quality checks
Practice & Deliver
1 EDA notebook with commentary
1 BI dashboard answering 3 stakeholder questions
Pick A Learning Path
Track A
- BI Deep-Dive: Tableau or Power BI
- Optional Python Primer
Track B
- Python EDA II: Feature Engineering Basics
- BI Deep-Dive
Track C
- Guided Capstone Project
- Mentor Feedback and Reviews
4. Analytics Projects and Portfolio
Learn
A/B testing basics and experiment design
Funnel analysis and cohort analysis
Dashboard performance and data quality checks
ETL fundamentals and data pipeline basics
Practice & Deliver
1 feature A/B testing plan with success metrics
1 funnel analysis with commentary
1 post-release performance readout
Pick A Learning Path
Track A
- Data Analyst Master's Capstone
- PL-300 Microsoft Power BI Training
- Model Data with Power BI
Track B
- Extract, Transform, and Load (ETL)
- Data Visualization using Tableau
- Applications of GenAI in Data Analytics
Track C
- Guided Capstone Project I
- Mentor Feedback and Reviews
- Live Instructor Support
5. Choose Your Specialization
Learn
Analytics domains: marketing, product, finance, and operations analytics
AI and data products: working with GenAI tools, LLM outputs, and automated pipelines
Domain-specific thinking: users, business models, metrics, and decision patterns across industries
Practice & Deliver
1 specialization-aligned analytics project
1 metric definition document aligned to target roles
1 interview story bank built around your chosen domain
Pick A Learning Path
Pro Tip
Specialization improves hiring relevance. Employers look for analysts who understand the specific metrics, users, and decisions of their industry, as well as general technical skills.
1. Entry-Level Foundations
Build role clarity, data literacy, and confidence with essential analytics tools.
Learn
What data analysts do, and how the role differs from data science or engineering
KPI literacy: CAC, LTV, revenue per user, conversion rate
Excel fluency: formulas, pivot tables, and charts
SQL basics: SELECT, WHERE, GROUP BY
Practice & Deliver
1 spreadsheet dashboard for a fictional business
1 KPI explainer for a business scenario
1 SQL query solving a basic business question
Pick A Learning Path
Track A
- Business Analytics with Excel
- SQL Certification Course
- Python Refresher with AI
Track B
- Excel in Business Analytics
- SQL Fundamentals Module
- KPI Mini-Workshop
Track C
- Program Orientation
- Intro to Analytics
- Excel and SQL Foundation
2. Core Data Skills
Build the practical analytics skills needed to contribute to reporting, discovery, and decision-making.
Learn
SQL: Joins, aggregates, CTEs
Excel: Advanced lookups (INDEX-MATCH, XLOOKUP), dynamic dashboards
Stats: Mean, median, standard deviation, correlation
Python: EDA with pandas and matplotlib (basics)
Practice & Deliver
1 Excel sales or operations dashboard
1 SQL churn analysis with commentary
1 BI dashboard answering 3 stakeholder questions
Pick A Learning Path
Track A
- Data Analytics with R
- Tableau Desktop Specialist Training
- Introduction to MS Azure Data Analytics
Track B
- Python EDA I: Cleaning and Profiling
- Data Analytics with Python
- BI 101
Track C
- Term-wise Modules: SQL, Excel, BI
- Guided Labs throughout the program
- Statistical Data Analysis
3. Programming and BI Tools
Build visualization skills and introduce Python for exploratory data analysis.
Learn
Python EDA: pandas and matplotlib
BI: calculated fields, parameters, and slicers
Data quality checks
Practice & Deliver
1 EDA notebook with commentary
1 BI dashboard answering 3 stakeholder questions
Pick A Learning Path
Track A
- BI Deep-Dive: Tableau or Power BI
- Optional Python Primer
Track B
- Python EDA II: Feature Engineering Basics
- BI Deep-Dive
Track C
- Guided Capstone Project
- Mentor Feedback and Reviews
4. Analytics Projects and Portfolio
Demonstrate judgment and skill through documented work that shows how you think.
Learn
A/B testing basics and experiment design
Funnel analysis and cohort analysis
Dashboard performance and data quality checks
ETL fundamentals and data pipeline basics
Practice & Deliver
1 feature A/B testing plan with success metrics
1 funnel analysis with commentary
1 post-release performance readout
Pick A Learning Path
Track A
- Data Analyst Master's Capstone
- PL-300 Microsoft Power BI Training
- Model Data with Power BI
Track B
- Extract, Transform, and Load (ETL)
- Data Visualization using Tableau
- Applications of GenAI in Data Analytics
Track C
- Guided Capstone Project I
- Mentor Feedback and Reviews
- Live Instructor Support
5. Choose Your Specialization
Build domain fluency so your analytics skills align with the roles you want.
Learn
Analytics domains: marketing, product, finance, and operations analytics
AI and data products: working with GenAI tools, LLM outputs, and automated pipelines
Domain-specific thinking: users, business models, metrics, and decision patterns across industries
Practice & Deliver
1 specialization-aligned analytics project
1 metric definition document aligned to target roles
1 interview story bank built around your chosen domain
Pick A Learning Path
Pro Tip
Specialization improves hiring relevance. Employers look for analysts who understand the specific metrics, users, and decisions of their industry, as well as general technical skills.
Key Things to Know
Most beginners can become job-ready in 4 to 6 months with consistent learning, practice, and portfolio projects.
Yes, follow the stages in order so you build core skills before moving into tools, projects, and specialization.
You can start with Excel, SQL, and visualization tools, but Python will help you handle advanced analysis later.
Free Data Analyst Upskilling Resources
Free Courses

Introduction to Data Analytics Course

Introduction to Data Mining Course
Data Analyst 101

Introduction to Data Science with R Programming

ChatGPT for Data Analytics

Python for Data Analysis

Data Analytics Projects

SQL for Data Analysis

Data Analytics Course for Beginners

Free Data Analyst Course
Introduction to Data Analytics Course
Introduction to Data Mining Course
Data Analyst 101
View More
Upcoming Webinars - Free Masterclasses

Path to $100k+ Salary Career in Data Analytics: Build & Grow Your Career

Break Into Data Analytics with this Microsoft-Backed Program
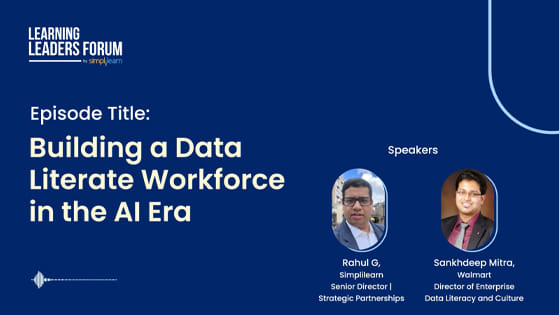
Building a Data-Literate Workforce in the AI Era
Articles and Ebooks That You Can Access For Free

Data Analyst vs. Data Scientist: What's the Difference?

Skilling for the Digital Economy: A Role-Based Approach

How to Build a Successful Data Analyst Career

Unlocking Client Value with GenAI: A Guide for IT Service Leaders to Build Capability


Data Analyst vs. Data Scientist: What's the Difference?
Skilling for the Digital Economy: A Role-Based Approach
How to Build a Successful Data Analyst Career
Unlocking Client Value with GenAI: A Guide for IT Service Leaders to Build Capability
Learners Also Explore


Connect with our learning consultant to get all your questions answered about programs, faculty, and more
Key Things to Know
Not at the entry level. SQL and Excel are often sufficient for early roles. Python becomes more valuable as you move into mid-level work involving larger datasets and automation.