
Free Data Analytics Courses
Build foundational analytical skills with Simplilearn's free data analytics courses. Designed entirely for beginners, these courses explain how organizations leverage unstructured information to monitor operational performance and make informed decisions. Topics include working with datasets, reviewing results, and presenting findings through reports. The courses also cover data preparation, analytical reporting, business intelligence, and other areas where data is used to support day-to-day business activities.
Learn data analytics concepts used to examine and interpret information
Understand reporting, visualization, and data-driven decision-making methods
Earn a free certificate and showcase analytics knowledge in a professional portfolio
Top Courses
Ranked highest among our most popular programs based on learner ratings.
Free Courses

Introduction to Data Analytics Course


Data Analyst 101
Free Data Analyst Course
Introduction to Data Analytics Course
Data Analyst 101
Free Data Analyst Course
Browse Free Data Analytics Courses
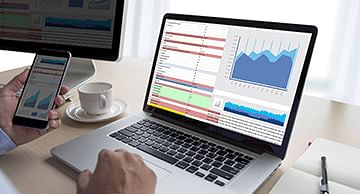










Data Analytics Courses Overview
Data analytics is the process of examining data to identify patterns, trends, and relationships that support business evaluation and decision-making. The process transforms raw data into useful information that organizations can apply to specific business objectives.
Collects information from business systems, applications, and operational activities
Organizes and prepares data so it can be reviewed accurately
Identifies trends, patterns, and performance changes within the data
Converts findings into reports, dashboards, and measurable business outcomes
Supports decisions related to operations, customer experience, revenue, and growth planning
Helps organizations act on evidence instead of assumptions when evaluating opportunities and challenges
Organizations increasingly rely on data to monitor performance, allocate resources, improve services, and evaluate business outcomes. As a result, the ability to analyze data has become a widely sought skill across many professional functions.
Companies use analytics to track performance across products, customers, operations, and financial activities.
Hiring demand extends across technology, healthcare, finance, retail, manufacturing, and other sectors.
Analytics supports faster decision-making by providing measurable evidence instead of assumptions.
Many business roles now require the ability to work with data, reports, and performance metrics.
Organizations invest in analytics to identify inefficiencies, reduce costs, and improve operational results.
Data literacy has become an expected capability across a growing number of professional positions.
Simplilearn's free data analytics courses cover the foundational capabilities required to work with analytical tasks across business and reporting environments.
Data quality assessment for identifying incomplete, inconsistent, or inaccurate records
Dataset structuring techniques for preparing information for analytical review
Statistical reasoning skills for interpreting numerical results and analytical outputs
Data summarization methods for presenting large volumes of information in a concise format
Analytical reporting techniques for communicating findings to business stakeholders
Visualization principles for presenting information through charts, graphs, and dashboards
Performance measurement techniques for tracking key metrics and evaluating outcomes
Simplilearn's free data analytics courses introduce several widely used tools for data preparation, analysis, reporting, and visualization tasks.
Microsoft Excel
Used for organizing, managing, and analyzing data in spreadsheets.
Performs calculations using formulas and functions.
Helps review business records, budgets, and performance data.
Supports data sorting, filtering, and basic reporting.
SQL
Used to access and retrieve information from databases.
Enables querying, filtering, and managing large volumes of data.
Supports reporting and business analysis activities.
Helps extract records needed for decision-making and insights.
Python
Used to analyze large datasets efficiently.
Automates repetitive analytical and data-processing tasks.
Supports data cleaning, transformation, and statistical analysis.
Widely used for advanced analytics, machine learning, and data visualization.
Power BI
Used to create interactive dashboards and business reports.
Helps teams monitor key performance indicators (KPIs) and metrics.
Enables data-driven decision-making through visual analytics.
Connects to multiple data sources for real-time reporting.
Tableau
Used to create visual reports and analytical dashboards.
Transforms complex data into easy-to-understand visualizations.
Helps communicate insights effectively to stakeholders.
Supports interactive exploration and sharing of business intelligence findings.
Data analytics is applied across several business functions to answer specific questions and support targeted business activities.
Marketing attribution examines which campaigns, channels, or touchpoints contribute most to conversions and revenue generation
Financial forecasting uses historical records and current business indicators to estimate future revenue, expenses, and cash flow
Customer churn analysis identifies characteristics associated with customer departures and highlights areas that may require retention efforts
Operational efficiency improvement examines workflow activity, resource allocation, and process completion rates to identify areas for refinement
Inventory planning uses historical demand patterns to support purchasing and stock management decisions
Sales analysis compares revenue activity across products, locations, and customer segments
Although these fields are closely related, each one serves a distinct role within a data-driven organization.
Data Analytics
Primary Focus: Examining existing information to understand what has occurred within the business.
Main Responsibility: Reviews data and produces findings that support business review activities.
Type of Work: Investigates business records, customer activity, financial data, and operational information.
Typical Deliverables: Analytical summaries, findings, and business recommendations.
Primary Users: Analysts, business teams, and department managers.
Data Science
Primary Focus: Developing models that estimate future outcomes using historical information.
Main Responsibility: Creates predictive and machine learning solutions for complex analytical problems.
Type of Work: Works with algorithms, statistical models, and predictive techniques.
Typical Deliverables: Forecasting models, classification models, and predictive outputs.
Primary Users: Data scientists, research teams, and advanced analytics groups.
Business Intelligence
Primary Focus: Delivering structured business reporting for stakeholders and leadership teams.
Main Responsibility: Maintains reporting environments used for organizational visibility.
Type of Work: Produces dashboards, scorecards, and scheduled reporting outputs.
Typical Deliverables: Executive dashboards, management reports, and KPI summaries.
Primary Users: Executives, managers, and reporting stakeholders.
Data Engineering
Primary Focus: Building the systems that collect, move, and store information across environments.
Main Responsibility: Maintains data infrastructure required for analytics and reporting activities.
Type of Work: Develops data pipelines, integration processes, and storage architectures.
Typical Deliverables: Reliable data pipelines, prepared datasets, and processing workflows.
Primary Users: Data engineers, platform teams, and technical departments.
Data analytics is the process of examining data to identify patterns, trends, and relationships that support business evaluation and decision-making. The process transforms raw data into useful information that organizations can apply to specific business objectives.
Collects information from business systems, applications, and operational activities
Organizes and prepares data so it can be reviewed accurately
Identifies trends, patterns, and performance changes within the data
Converts findings into reports, dashboards, and measurable business outcomes
Supports decisions related to operations, customer experience, revenue, and growth planning
Helps organizations act on evidence instead of assumptions when evaluating opportunities and challenges
Organizations increasingly rely on data to monitor performance, allocate resources, improve services, and evaluate business outcomes. As a result, the ability to analyze data has become a widely sought skill across many professional functions.
Companies use analytics to track performance across products, customers, operations, and financial activities.
Hiring demand extends across technology, healthcare, finance, retail, manufacturing, and other sectors.
Analytics supports faster decision-making by providing measurable evidence instead of assumptions.
Many business roles now require the ability to work with data, reports, and performance metrics.
Organizations invest in analytics to identify inefficiencies, reduce costs, and improve operational results.
Data literacy has become an expected capability across a growing number of professional positions.
Simplilearn's free data analytics courses cover the foundational capabilities required to work with analytical tasks across business and reporting environments.
Data quality assessment for identifying incomplete, inconsistent, or inaccurate records
Dataset structuring techniques for preparing information for analytical review
Statistical reasoning skills for interpreting numerical results and analytical outputs
Data summarization methods for presenting large volumes of information in a concise format
Analytical reporting techniques for communicating findings to business stakeholders
Visualization principles for presenting information through charts, graphs, and dashboards
Performance measurement techniques for tracking key metrics and evaluating outcomes
Simplilearn's free data analytics courses introduce several widely used tools for data preparation, analysis, reporting, and visualization tasks.
Microsoft Excel
Used for organizing, managing, and analyzing data in spreadsheets.
Performs calculations using formulas and functions.
Helps review business records, budgets, and performance data.
Supports data sorting, filtering, and basic reporting.
SQL
Used to access and retrieve information from databases.
Enables querying, filtering, and managing large volumes of data.
Supports reporting and business analysis activities.
Helps extract records needed for decision-making and insights.
Python
Used to analyze large datasets efficiently.
Automates repetitive analytical and data-processing tasks.
Supports data cleaning, transformation, and statistical analysis.
Widely used for advanced analytics, machine learning, and data visualization.
Power BI
Used to create interactive dashboards and business reports.
Helps teams monitor key performance indicators (KPIs) and metrics.
Enables data-driven decision-making through visual analytics.
Connects to multiple data sources for real-time reporting.
Tableau
Used to create visual reports and analytical dashboards.
Transforms complex data into easy-to-understand visualizations.
Helps communicate insights effectively to stakeholders.
Supports interactive exploration and sharing of business intelligence findings.
Know More About Free Data Analytics Courses
According to Fortune Business Insights, the global data analytics market was valued at USD 82.23 billion in 2025 and is projected to reach USD 495.87 billion by 2034, growing at a 21.50% compound annual growth rate (CAGR). This expansion reflects increasing investment in technologies that support data processing, reporting, forecasting, and analytical operations.
As adoption continues to grow across both public and private sectors, demand for foundational analytics knowledge remains closely tied to the broader growth of the data economy. Simplilearn's Free Data Analytics Courses provide an accessible starting point for learners entering this rapidly expanding field.
Who Should Enroll in Free Data Analytics Courses Online?
Simplilearn offers a range of free data analytics courses online with a certificate for learners with different goals and professional backgrounds. The table below highlights the courses best aligned with each learner profile.
Business Analysts Wanting to Move from Intuition-Based to Data-Driven Decisions
Recommended Courses:
Why These Courses Fit:
Learn how to interpret business data and identify trends.
Develop analytical thinking and data-driven decision-making skills.
Gain practical knowledge of reporting and business analysis techniques.
Marketing and Sales Professionals Measuring Campaign and Revenue Performance
Recommended Courses:
Why These Courses Fit:
Learn how to analyze campaign performance and customer behavior.
Use data to evaluate sales trends and revenue growth.
Develop skills for creating performance reports and insights.
Operations Managers Identifying Inefficiencies Through Data Analysis
Recommended Courses:
Why These Courses Fit:
Learn to identify process bottlenecks and operational inefficiencies.
Understand how data can support workflow optimization.
Gain exposure to large-scale data analysis concepts.
Finance Professionals Building Analytical Depth for Reporting and Forecasting
Recommended Courses:
Why These Courses Fit:
Develop skills for financial reporting and data analysis.
Learn forecasting and trend analysis techniques.
Use data to support budgeting and financial decision-making.
Students and Freshers Targeting Entry-Level Analyst Roles Across Industries
Recommended Courses:
Why These Courses Fit:
Build a strong foundation in data analytics concepts.
Learn essential tools and techniques used by analysts.
Prepare for entry-level roles in business, finance, marketing, and operations analytics.
Career After Completing Free Data Analytics Certificate
Simplilearn's free data analytics courses introduce capabilities that support a wide range of analytical roles. The table below highlights several career paths where these skills are commonly applied.
Data Analyst
Reviews organizational records and business data.
Prepares reports, summaries, and analytical findings.
Identifies trends and patterns that support business decision-making.
Provides insights to improve operational and business performance.
Average Annual Salary (US): $85,605
Business Intelligence Analyst
Maintains reporting systems and business intelligence environments.
Creates dashboards, reports, and performance metrics.
Delivers information required by managers and leadership teams.
Supports strategic planning through data-driven insights.
Average Annual Salary (US): $94,966
Marketing Analytics Specialist
Analyzes marketing campaigns and audience engagement metrics.
Evaluates conversion rates and customer acquisition performance.
Measures the effectiveness of marketing channels and strategies.
Provides recommendations to improve campaign results.
Average Annual Salary (US): $61,031
Supply Chain Analyst
Reviews inventory movement and supply chain operations.
Analyzes fulfillment activities and logistics performance.
Identifies opportunities to improve efficiency and reduce costs.
Supports operational planning and resource management.
Average Annual Salary (US): $81,553
Financial Analyst
Assesses financial records, budgets, and revenue performance.
Conducts financial forecasting and trend analysis.
Supports planning, investment, and resource allocation decisions.
Provides insights to improve financial performance.
Average Annual Salary (US): $83,856
Product Analyst
Evaluates product adoption and feature usage metrics.
Analyzes customer behavior and user engagement data.
Identifies opportunities for product improvements and growth.
Supports product development and prioritization decisions.
Average Annual Salary (US): $104,286
Next Steps After Your Free Data Analytics Training
After completing the free data analytics courses, the next step is to apply analytical techniques to larger projects and expand into more specialized areas of the field.
Build a Complete Analytics Project: Choose a public dataset and complete an analysis from start to finish. Clean the data, examine the results, document your findings, and add the project to your portfolio.
Strengthen SQL Skills: Practice joins, window functions, common table expressions, and query optimization. These topics are frequently used when working with larger datasets and more complex business questions. Strong SQL skills are especially valuable for aspiring Associate Data Analyst professionals and other entry-level analytics roles.
Create a Dashboard: Build a dashboard in Power BI or Tableau and include it in your portfolio. A well-structured dashboard helps demonstrate your ability to present information clearly and effectively. Developing data visualization skills allows you to transform raw data into insights that stakeholders can quickly understand and act upon.
Continue With Advanced Training: A free Google Data Analytics course online or a professional data analytics program can help you expand your knowledge and gain exposure to additional tools, methods, and real-world workflows.
Understand A/B Testing: Learn how organizations compare different versions of a product, campaign, or process to measure results. A/B testing helps teams evaluate changes before rolling them out on a larger scale.
Articles and Ebooks That You Can Access For Free

Top Rebranding Trends
Professional Sentiment Survey 2026

Top Cloud Platforms and Reasons to Learn Them
Professional Sentiment Survey by Simplilearn














Top Rebranding Trends
Professional Sentiment Survey 2026
Top Cloud Platforms and Reasons to Learn Them
Professional Sentiment Survey by Simplilearn
FAQs About Free Data Analytics Training
Excel is usually the first tool to learn because it covers sorting, filtering and basic calculations in a familiar layout. SQL comes next for working with stored records. Python adds more depth later. A free data analytics with Excel course gives beginners a simple starting point without pushing advanced technical work too early.
Are free data analytics course certificates recognised for analyst job applications?
A certificate can support an application because it shows structured study and course completion. Hiring teams still look for project work, clear query writing and the ability to explain results. For free data analytics courses for working professionals, the certificate matters most when it appears alongside sample work that shows the skill in use.
Do these courses cover data storytelling and presenting insights to stakeholders?
Yes. The courses cover how to turn findings into charts, summaries and clear messages for others. A free data analytics and visualization course usually needs to go beyond numbers alone, so the material also supports presentation and explanation skills. Learning data visualization helps analysts communicate insights more effectively to managers, clients, and internal teams while supporting informed business decisions.
How much SQL and Python do I need to know to work as a data analyst?
Most data analyst roles require a solid understanding of SQL for retrieving, filtering, and combining data from databases. Python is commonly used for data preparation, analysis, and automation tasks. A free SQL and data analytics course online can help learners develop the foundational SQL and Python knowledge frequently expected for entry-level and intermediate analyst positions.
Which industries hire the most data analysts and offer the best salaries?
Finance, technology, healthcare, consulting, and retail are among the largest employers of data analysts. Demand is also growing in manufacturing, logistics, e-commerce, and digital marketing, where organizations rely on data to improve performance and customer engagement. Salary levels vary by industry, location, experience, and job responsibilities, with technical and specialized analytical roles often offering higher compensation than entry-level positions.
Can someone from a non-quantitative background become a data analyst through free training?
Yes. A non-quantitative background does not block entry into this field. A free data analytics course for beginners in 2026 material usually starts with straightforward examples that build comfort step by step. and gain in-demand skills that support career growth. Many successful analysts come from diverse backgrounds, including business, communications, and digital marketing, before transitioning into analytics roles.
What tools should a beginner learn first for data analytics?
Excel is usually the first tool to learn because it covers sorting, filtering, and basic calculations in a familiar layout. SQL comes next for working with stored records — the SQL courses and PostgreSQL courses build that foundation, while MongoDB courses cover the NoSQL side for less structured data. Once you're comfortable retrieving data, Tableau courses teach you to turn it into dashboards and visual reports that stakeholders can act on.

*All salary figures referenced are based on data reported by employees on Glassdoor. These figures are estimates and may vary depending on location, experience level, company policies, and market conditions. Actual compensation may differ.